
close
Choose Your Site
Global
Social Media

Views: 0 Author: Site Editor Publish Time: 2026-10-30 Origin: Site


Plastic component manufacturing carries immense stakes on the factory floor. Subtle material variances often lead to catastrophic field failures later. These small deviations also cause frustrating processing bottlenecks during daily production. Engineers simply cannot afford blind spots regarding raw material behavior. Differential Scanning Calorimetry (DSC) provides this absolutely critical visibility. It functions as much more than a standard laboratory tool. It acts as a mandatory risk-mitigation checkpoint across the entire supply chain. Routine thermal analysis supports strict material qualification and robust quality control. It also drives highly accurate failure analysis investigations when things go wrong.
Bridging the gap between raw thermal data and commercial engineering decisions requires specialized skill. This guide explains how to read and analyze these complex datasets accurately. You will learn to extract actionable insights from nuanced thermal responses. We will also show you how to avoid the most common analytical traps threatening your data integrity.
Thermal History is Critical: Reliable interpretation requires comparing the first heating scan (real-world state) with the second heating scan (inherent material properties).
Precision Matters: Misidentifying the polymer crystallization temperature (Tc) or melting peak (Tm) can lead to improper injection molding cycle times and compromised structural integrity.
Context Over Data: Raw DSC graphs are only valuable when interpreted against standardized testing protocols (e.g., ASTM D3418) and specific processing parameters.
Lab Evaluation: Selecting a testing partner requires evaluating their calibration rigor, compliance credentials, and ability to translate curves into actionable material insights.
Mastering DSC curve interpretation fundamentally changes how manufacturers operate today. It shifts quality assurance from a reactive guessing game to a proactive science. This analytical capability directly protects product safety and corporate reputation. It ensures every polymer behaves exactly as expected under stress.
Every single batch of incoming raw resin requires strict verification. Relying solely on a supplier technical data sheet leaves too much room for error. Thermal analysis provides definitive, mathematical proof of material identity. It confirms thermal fingerprints match your expected manufacturing specifications perfectly. This immediate check prevents out-of-spec materials from ever entering the production hopper. Catching degraded or incorrect resin early saves thousands of dollars. It prevents wasted machine time and eliminates costly downstream product recalls.
Injection molding and extrusion rely entirely on precise temperature control. Pinpointing exact melting points removes dangerous guesswork from barrel temperature settings. Understanding how a polymer crystallizes dictates the required cooling rates inside the mold. Operators use these thermal insights to optimize their cycle times aggressively. Shaving just two seconds off a cooling cycle yields massive annual volume increases. Proper temperature settings also ensure molded parts cool evenly throughout. This uniformity prevents part warping and reduces overall scrap rates significantly.
Field failures often stem from invisible microscopic material defects. Thermal analysis acts as a highly effective diagnostic tool in these urgent situations. Shifted melting curves often indicate severe polymer degradation during processing. Secondary peaks usually point directly toward cross-contamination occurring in the material handling system. Finding a small polyethylene peak inside a polypropylene sample explains brittle failures instantly. These unexpected thermal responses also reveal improper additive blending ratios. Identifying these anomalies helps engineers trace defects back to their root cause.
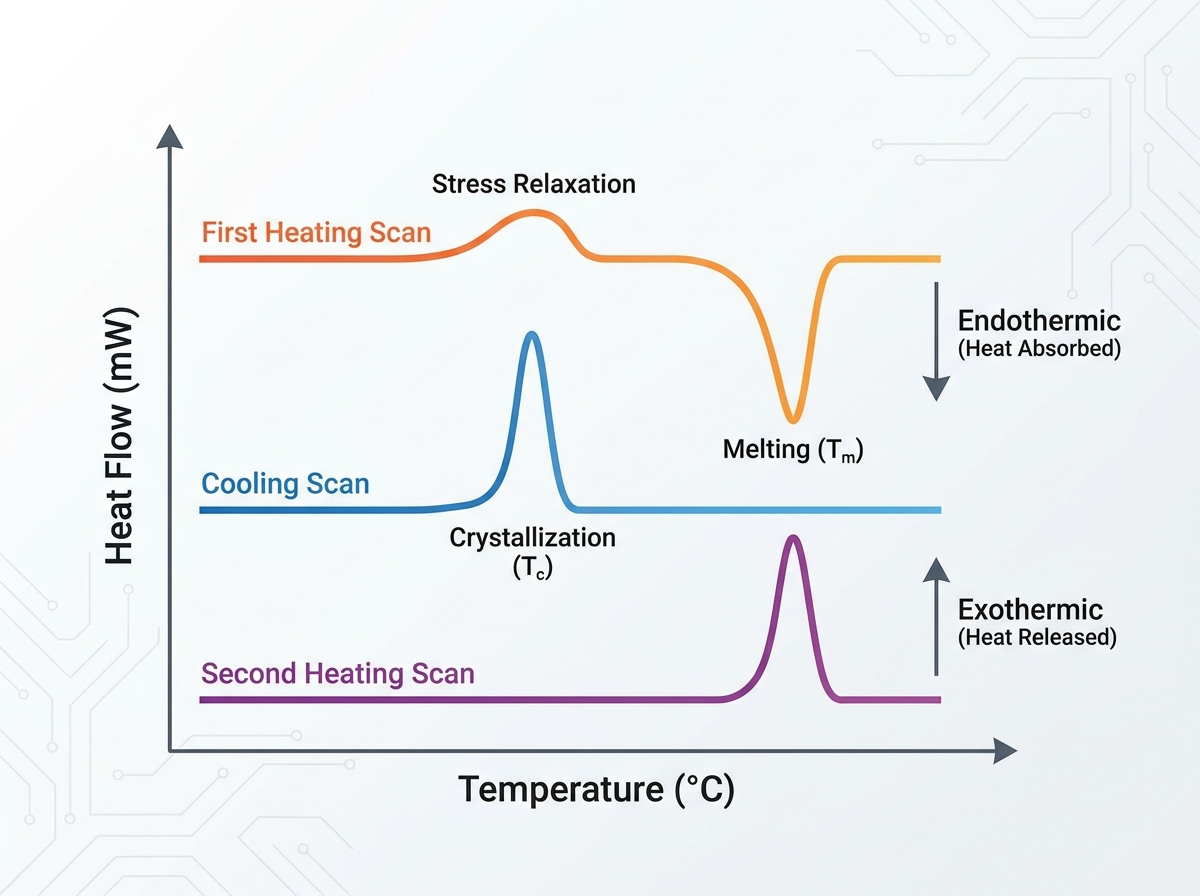
Analyzing thermal behavior requires understanding the basic rules of physical energy transfer. Every peak and valley on the graph tells a highly specific thermodynamic story. Technicians must learn to read these shapes accurately to understand the polymer.
Thermal analysis hinges on tracking heat flow into or out of a sample. Melting always represents a fundamental endothermic process. The solid polymer matrix absorbs applied energy to break down rigid crystalline structures. Depending on your specific instrument convention, endothermic peaks point either up or down. Conversely, crystallization represents a standard exothermic process. As polymer chains neatly arrange themselves into crystals, they release internal heat. The sensor detects this released energy instantly. Distinguishing between these two energy flows forms the absolute foundation of DSC melting and crystallization analysis.
Standard Thermal Transitions Chart
Thermal Event | Process Classification | Heat Flow Direction | Material Significance |
|---|---|---|---|
Glass Transition (Tg) | Heat Capacity Change | Baseline Shift | Marks the transition from a brittle to a rubbery state. |
Cold Crystallization | Exothermic | Heat Released | Shows disorganized chains arranging themselves during heating. |
Melting (Tm) | Endothermic | Heat Absorbed | Signifies the complete breakdown of solid crystalline structures. |
Melt Crystallization (Tc) | Exothermic | Heat Released | Occurs during cooling as polymer chains solidify structurally. |
Finding the exact melting point requires isolating the endothermic peak area carefully. The peak minimum (or maximum) represents the true melting temperature (Tm). However, the total area calculated under this curve holds equal importance. This integrated area calculates the sample's heat of fusion, also known as enthalpy. Engineers compare this measured enthalpy against established theoretical values. This calculation determines the exact degree of crystallinity within the tested sample. Higher crystallinity typically yields physically stronger but significantly more brittle finished parts.
Heating data only tells half the story regarding material behavior. Operators must read the cooling curve to evaluate solidification speed. Tracking the exothermic peak identifies the precise polymer crystallization temperature. You must note both the onset and peak values during this phase. The onset temperature signals exactly when crystals first begin forming. The peak temperature indicates the absolute maximum rate of crystallization. This metric proves absolutely critical for injection molders. It directly dictates how fast a liquid plastic will solidify inside a chilled steel mold.
Thermal history dramatically alters a material's physical behavior. A molded part retains severe internal stresses from rapid factory cooling. The first heating scan captures these "as-received" real-world conditions perfectly. Analysts use this first pass to evaluate actual molding quality. However, evaluating true raw material properties requires a second heating scan. The instrument first cools the sample at a controlled, standardized rate. This controlled cooling erases the previous manufacturing thermal history completely. The second scan then reveals the fundamental, inherent polymer characteristics. Comparing these two scans highlights dangerous processing-induced flaws quickly.
Even highly sophisticated calorimeters produce misleading data if operated incorrectly. Bad data inevitably leads to terrible manufacturing decisions on the floor. Analysts must actively avoid several well-documented testing errors to maintain accuracy.
Sample Preparation Errors: Consistent sample mass remains non-negotiable for accurate peak comparisons. Variations in sample weight skew the resulting peak areas wildly. Experts recommend aiming for a precise mass between 5 to 10 milligrams. Furthermore, poor sample-to-pan contact causes significant thermal lag. The sensor cannot read heat flow efficiently across empty air gaps. You must press samples entirely flat against the aluminum pan bottom. Cutting a flat slice from a pellet works much better than dropping a round pellet inside. Pan contamination also creates severe baseline instability. Always use clean tweezers and wear proper laboratory gloves during preparation.
Misinterpreting Moisture and Stress Relaxation: Polymers like nylon and PET frequently absorb moisture from the surrounding environment. During heating, this trapped water vaporizes very quickly. Moisture volatilization creates broad, confusing endothermic peaks on the graph. Novice technicians often mistake these moisture curves for true melting points. Similarly, enthalpy relaxation at the glass transition mimics an endothermic peak. You must look for the corresponding baseline shift to confirm a true Tg. Re-running a properly dried sample easily resolves any moisture confusion.
Heating and Cooling Rate Distortions: The speed of your temperature ramp directly impacts peak placement. Aggressive heating rates push recorded peak temperatures artificially high. For example, scanning at 30°C per minute introduces severe thermal lag into the system. Standardizing heating rates at 10°C or 20°C per minute ensures excellent data repeatability. If you compare two different materials, you must test them using identical temperature profiles. Otherwise, the comparative data loses all scientific validity entirely.
Assuming DSC Solves Everything: No single analytical technique provides a fully complete material profile. Thermal analysis excels at measuring distinct physical transitions. It cannot, however, identify unknown polymer chemistries entirely on its own. It also struggles to separate complex multi-component blends perfectly. Maintain a healthy skepticism regarding standalone thermal data. Rely on complementary techniques for deep chemical investigations. Fourier-transform infrared spectroscopy (FTIR) identifies exact chemical bonds. Combining FTIR data with thermal curves provides a truly comprehensive material analysis.
Many organizations outsource thermal analysis to independent commercial laboratories. Selecting the right testing partner heavily influences your quality control success. You must evaluate labs well beyond their basic equipment lists.
Commercial testing demands rigorous adherence to recognized international frameworks. High-quality labs build their procedures strictly around ASTM D3418 or ISO 11357 standards. These globally recognized protocols dictate precise sample preparation and scanning rules. Adhering strictly to these frameworks guarantees legally and commercially defensible data. Defensible data protects you during supplier disputes or warranty claims. Always ask potential partners to provide their specific ISO compliance credentials upfront.
Thermal sensors naturally drift over time and require frequent adjustments. Decision-makers must ask laboratories about their internal calibration frequency. Top-tier facilities calibrate their instruments daily using certified Indium or Zinc standards. You must also inquire about calorimeter resolution capabilities. Detecting subtle secondary peaks demands highly sensitive heat flux sensors. High sensitivity prevents misreading baseline noise as a glass transition event. Outdated equipment simply misses the small thermal events causing your production issues.
A thick stack of printed graphs offers zero value to a busy floor manager. Define a high-value testing service strictly by its reporting quality. Exceptional labs provide deeply contextualized engineering reports. They translate complex thermal curves into plain-language manufacturing insights. They offer clear go/no-go recommendations for specific production batches. Look for partners who explain exactly why a melting peak shifted, rather than just reporting the shift.
Material testing needs vary drastically throughout the manufacturing year. Sometimes you need routine, high-volume batch checks for incoming raw materials. Other times, you face complex, one-off failure investigations halting entire production lines. Evaluate the laboratory's capacity to handle both extremes efficiently. A strong partner processes high-volume QC samples rapidly without sacrificing analytical accuracy. They should also possess the deep expertise required for intensive, custom diagnostic projects.
Interpreting thermal curves correctly serves as the ultimate linchpin of polymer quality assurance. Accurate analysis guarantees process stability across injection molding and extrusion manufacturing lines. It prevents catastrophic failures by catching degraded or contaminated resin before processing begins. Manufacturers who master these analytical techniques gain a significant competitive edge in yield and overall reliability.
Take immediate action to secure your production lines today. Encourage your quality managers to audit current internal testing protocols thoroughly. Standardize your thermal history parameters to ensure repeatable, accurate data collection. Finally, do not hesitate to consult a certified testing laboratory. Expert third-party validation proves essential when resolving complex material disputes or mysterious field failures. Proactive material analysis always costs far less than reactive scrap replacement.
A: You calculate this by measuring the sample's heat of fusion from the melting peak area. Divide this measured value by the theoretical heat of fusion for a perfectly crystalline version of that exact same polymer. Finally, multiply the resulting decimal by 100 to get the percentage. This standard mathematical formula accurately reveals the crystalline fraction.
A: Several variables cause this specific thermal shift. Variations in the base polymer's molecular weight heavily influence crystallization speed. The presence or absence of nucleating agents alters onset temperatures dramatically. Unwanted impurities act as accidental nucleators, artificially accelerating the process. Finally, inconsistent cooling rates during the actual lab test easily skew the recorded temperature data.
A: Yes, it can differentiate blends successfully under the right conditions. The blended polymers must have distinct, non-overlapping melting points or glass transition temperatures. If their thermal transitions occur far apart, standard testing separates them clearly. However, if the materials share similar transition zones, complex overlapping peaks occur. These overlaps require advanced techniques like Modulated DSC (MDSC) for accurate separation.


